
📊 Queue Statistics & Reporting Guide #
This document explains how to view, analyze, and schedule queue reports using the Dataphone Analytics Reporting Portal.
https://portal.dataphone.cloud/reports/analytics
The portal provides tools to:
✔ Monitor queue performance
✔ Track answered and missed calls
✔ Analyze agent activity
✔ Filter detailed call data
✔ Schedule automated reports sent via email
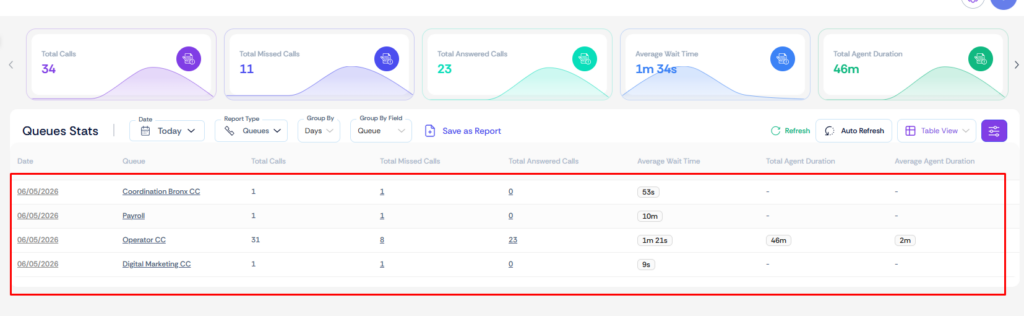
🖥 Analytics Dashboard Overview #
The Analytics Dashboard provides a quick visual summary of queue activity using widgets. These widgets automatically update based on the date range and filters applied.
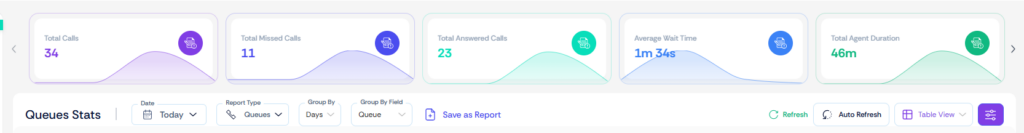
📊 Queue Performance Widgets #
Widgets display key metrics that help monitor queue performance.
📞 Total Calls #
Displays the total number of calls that entered the queue during the selected time period.
This includes both answered and unanswered calls.
❌ Total Missed Calls #
Shows the number of calls that were not answered by any agent.
These calls may have exited the queue due to:
- Timeout
- Caller hangup
- No agents available
- Exit key pressed
✅ Total Answered Calls #
Displays the total number of calls successfully answered by agents in the queue.
This metric helps measure queue responsiveness.
⏱ Average Wait Time #
Shows the average time callers waited in the queue before being answered.
A lower wait time generally indicates better queue efficiency and customer experience.
👨💼 Total Agent Duration #
Represents the total time agents spent actively speaking with callers.
This is the combined talk time of all agents within the selected reporting period.
📈 Average Agent Duration #
Displays the average length of calls handled by agents.
This helps measure typical call handling time.
📊 Additional Optional Widgets #
Some advanced widgets may be hidden by default, but can be enabled when deeper analytics are required by hovering over a widget and clicking on +.
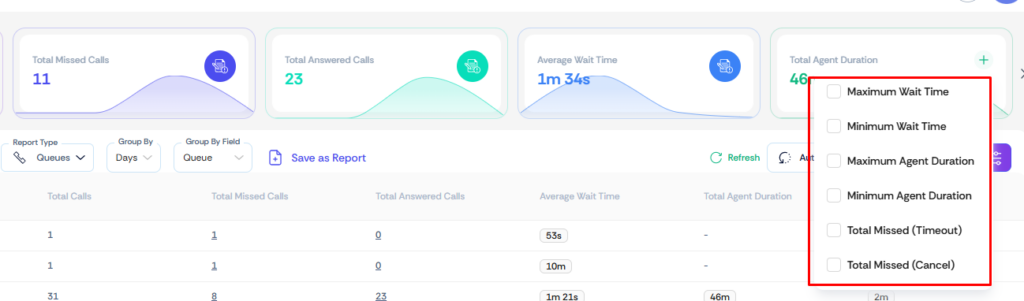
| Metric | Description |
| ⌛ Maximum Wait Time | The longest time a caller waited in the queue during the selected reporting period. |
| ⚡ Minimum Wait Time | The shortest wait time recorded for calls entering the queue. |
| 📞 Maximum Agent Duration | The longest call duration handled by an agent during the selected reporting period. |
| 📞 Minimum Agent Duration | The shortest call duration handled by an agent. |
| 📞 Total Missed (Timeout) | The calls are missed after being in the queue before the timeout condition kicks in. |
| 📞 Total Missed (Cancel) | The call was missed while in the queue, and the caller hung up before the Queue Timeout. |
📑 Generating Reports from the Analytics Portal #
Users can generate detailed reports directly from the analytics portal using filters and grouping options.
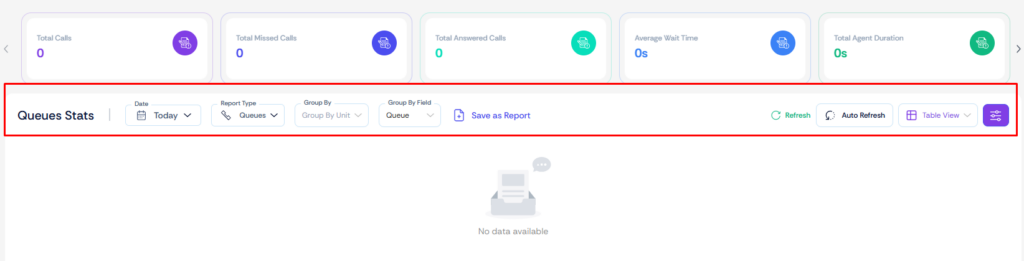
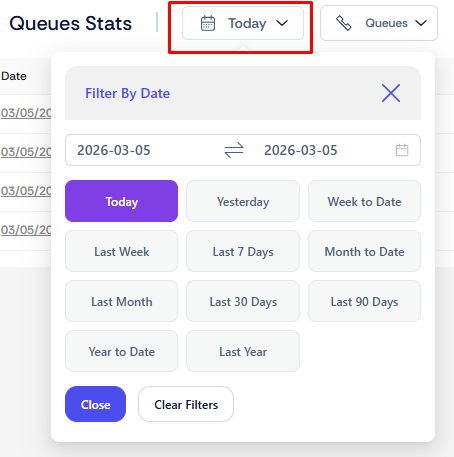
📅 Step 1 — Select Date Range #
Choose the period for which you want to analyze call activity.
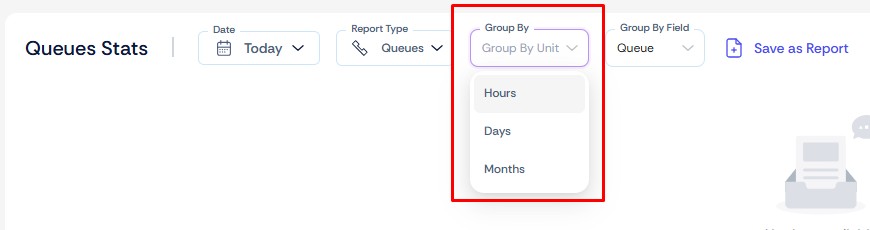
⏰ Step 2 — Select Time Grouping #
Reports can be grouped based on different time intervals.
| Option | Description |
| Hourly | Shows call activity hour by hour |
| Daily | Displays statistics for each day |
| Monthly | Aggregate statistics by month |
This helps identify traffic patterns and peak call hours.
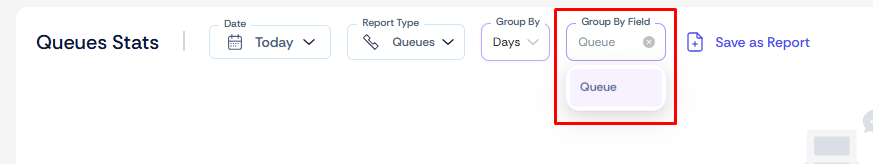
🗂 Step 3 — Group by Queue #
The Group By option determines how the report data is separated.
• No Group Selected
Displays combined statistics for all queues.
• Group By Queue
Displays statistics individually for each queue.
This is especially useful when managing multiple departments or service queues.
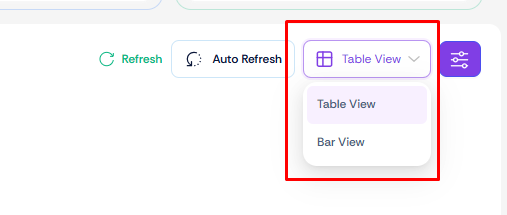
📊 Step 4 — Report Visualization #
Reports can be displayed in two formats.
📋 Table View #
Shows the data in numeric format, ideal for detailed analysis.
📊 Bar Chart View #
Displays a visual comparison of statistics, making it easier to identify trends.
🔎 Advanced Report Filters #

Advanced filters allow you to narrow down the results and analyze specific call data.
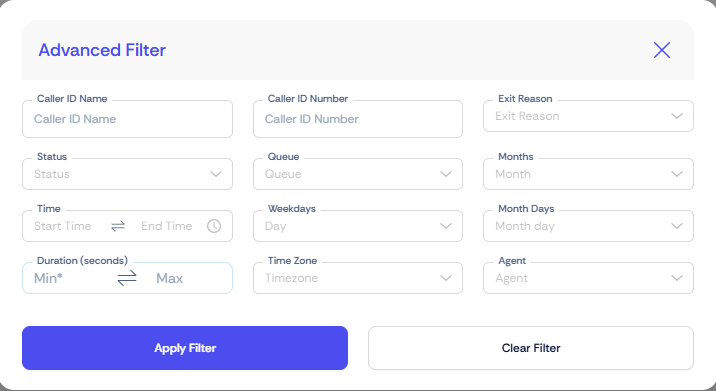
👤 Caller ID Filter #
Filter reports by specific caller name or phone number.
📞 Call Status Filter #
Filter calls by outcome.
Available options include:
• Answered
• Missed
📞 Queue Filter #
Allows selecting one or multiple queues to view statistics for only those queues.
🚪 Exit Reasons for Unanswered Calls #
When a call is not answered, the system records the reason the caller exited the queue.
| Exit Reason | Description |
| ⏳ Timeout | The call remained in the queue but no agent answered before the configured timeout limit was reached. |
| 📵 Hangup | The caller disconnected the call before it was answered by an agent or time out reached. |
| 🚫 No Agent Timeout | The call entered the queue but no agents were available or logged in, causing the call to time out automatically. |
| 🔘 Key Press Exit | The caller pressed a configured key (such as *) to exit the queue and trigger another action. |
🕒 Nested Time Filters #
Additional time filters allow further narrowing of the report results.
These filters work within the previously selected date range and allow filtering by:
• Time of day
• Specific dates
• Time zones
👨💼 Agent Filter #
Reports can also be filtered to display data for specific agents within the queue.
This is helpful when analyzing agent performance or call handling activity.
▶ Generating the Report #
Once all filters are configured, click Apply to generate the report.
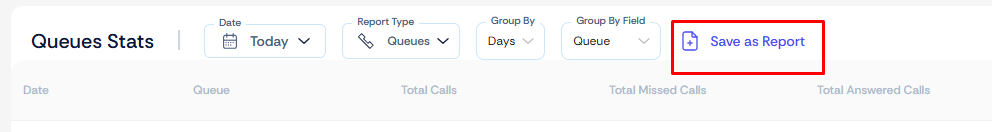
📧 Scheduling Automatic Reports #
The portal also allows reports to be automatically generated and emailed as Excel files.
💾 Step 1 — Save as Report #
After configuring your report filters, click Save as Report.
This will open the Create Custom Report window.
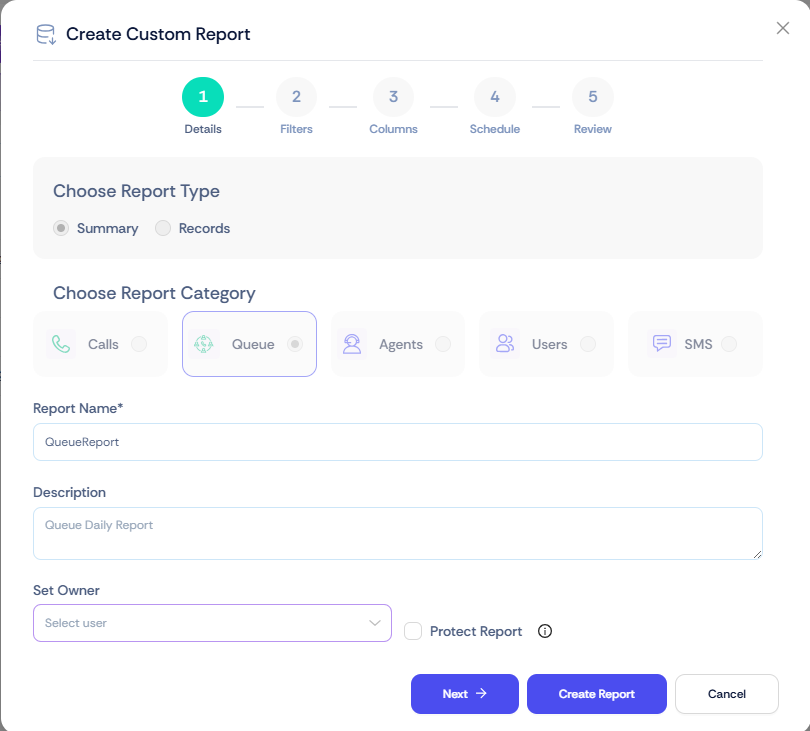
📝 Step 2 — Report Details #
Enter the following information:
Report Name
A clear name for the report.
Description
A short explanation describing the purpose of the report. This is optional
Set Owner
Set Owner of this custom Report
Note: Without setting the report owner, the report scheduler will not work.
Protect Report:
If selected, No one apart from Admin can edit this custom report.
Click Next to continue.
📅 Step 3 — Select Report Date Range #
Choose the date range for the scheduled report.
Examples:
• Weekly report → Select Last Week
• Monthly report → Select Last Month
This ensures each report automatically extracts the correct data period.
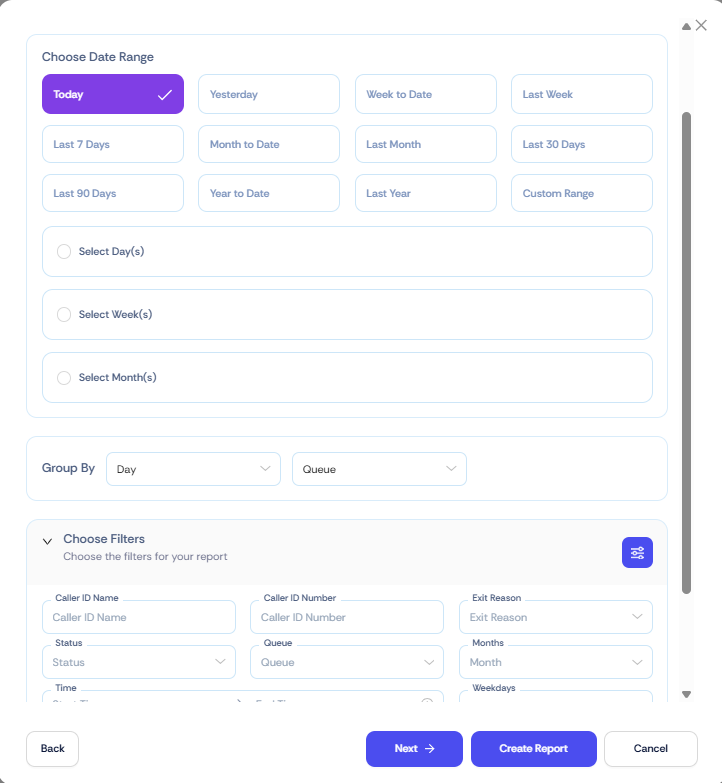
🔎 Step 4 — Apply Filters #
Select the filters that should be applied to the report.
Filters may include:
• Queue
• Agent
• Call status
• Caller ID
• Exit reason
• Date and time filters
Once selected, click Next.
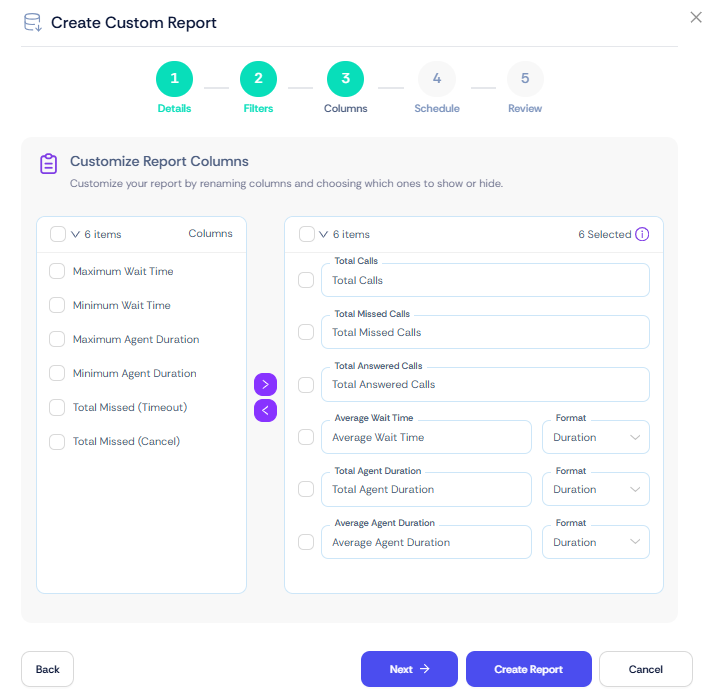
📊 Step 5 — Select Report Columns #
Choose the columns that should appear in the report.
These columns correspond to the metrics shown in the dashboard widgets and analytics reports.
Click Next to proceed.
⏰ Step 6 — Schedule the Report #
Scheduling is disabled by default.
Enable scheduling by toggling the Schedule Report option.
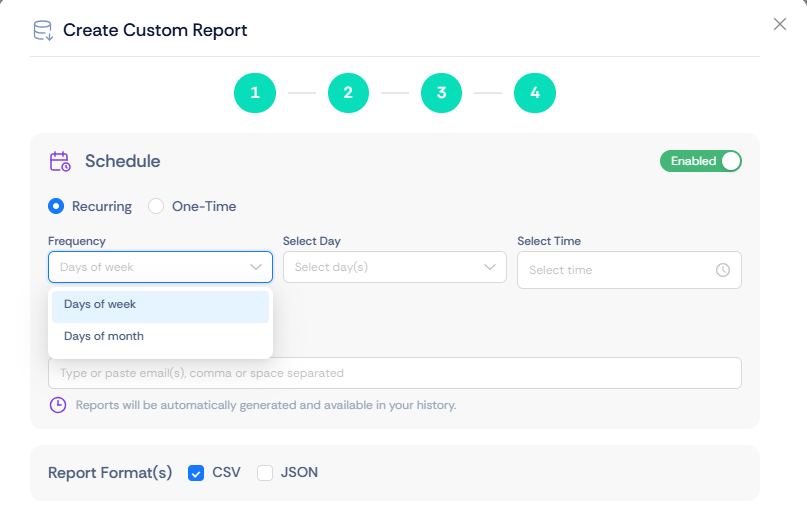
🔁 Recurring Report Options #
Reports can be scheduled to run automatically.
| Schedule Option | Description |
| 📆 Day of the Week | Used for daily or weekly reports.Example: Every Monday at 9:00 AM. |
| 📅 Day of the Month | Used for monthly reports.Example: 1st and 15th of each month. |
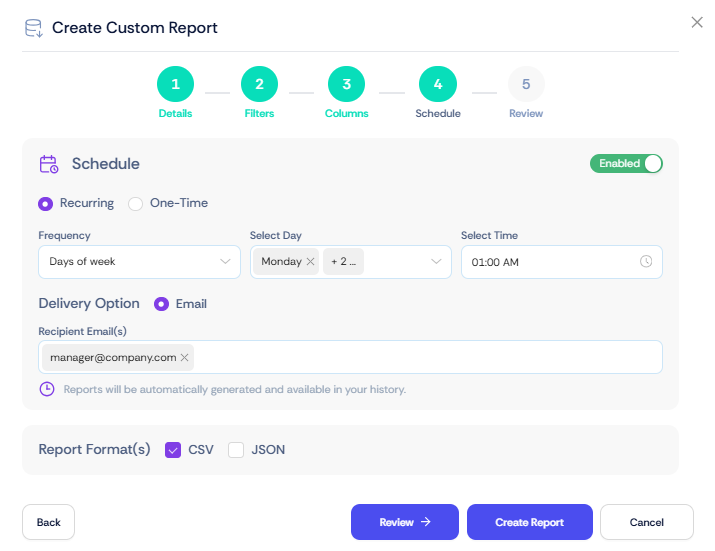
📧 Email Recipients #
Enter the email addresses where the report should be delivered.
Multiple recipients can be added by separating emails with commas or spaces.
Example:
support@company.com, manager@company.com
✔ Final Step #
Click Review or Create Report.
The report will then be automatically generated and sent according to the configured schedule.
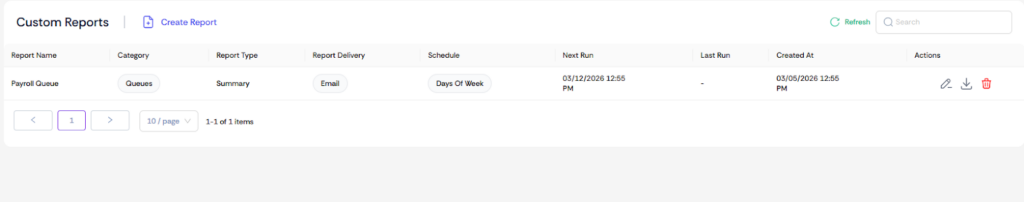
📁 Managing Scheduled Reports #
All scheduled reports can be viewed from the Custom Reports page.
From here you can:
| Action | Description |
| 📄 View Scheduled Reports | See a list of all reports that have been created and scheduled in the system. |
| ⚙ Edit Report Settings | Modify report configuration such as filters, columns, schedule timing, or recipients. |
| ⏸ Disable Scheduling | Temporarily stop the automatic generation and delivery of the scheduled report without deleting it. |
| 🗑 Delete Reports | Permanently remove a scheduled report from the system. |
| ⬇ Download Last Compiled Report | Download the most recently generated version of the report directly from the portal. |